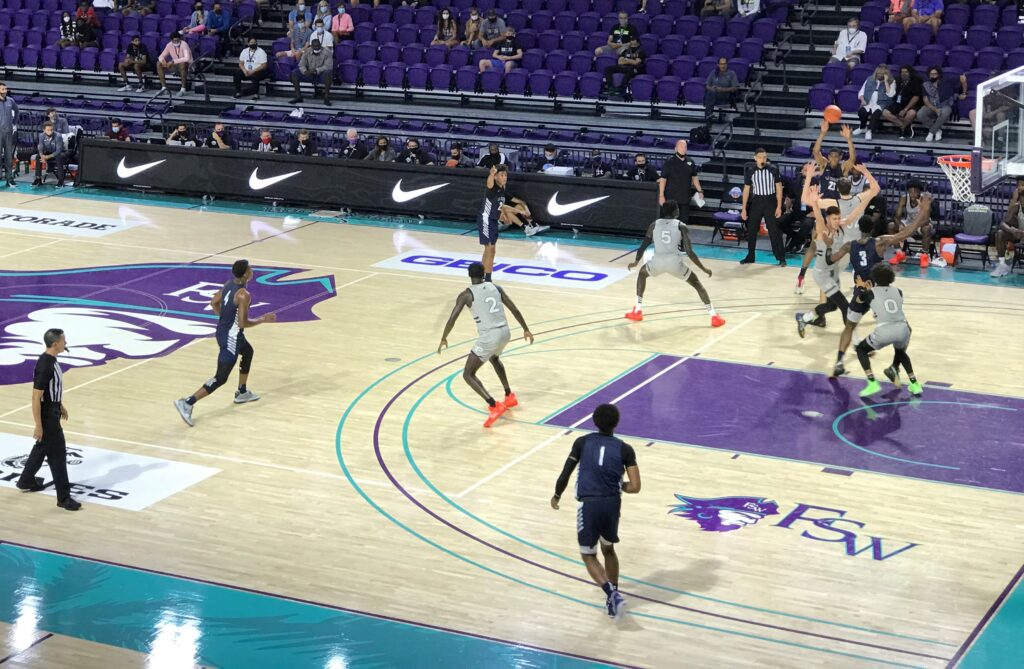
 Since the ability to score is the most crucial factor in winning basketball games, we need to have a simple system for helping players to understand how well they are contributing to our team’s efforts to score.
The problem is that the three most common metrics we use to measure the ability to score are not true indicators and do not give us the best information regarding a players ability to score points in a way that contributes to a team’s chances of winning a game.
Scoring Average (Points per Game)
A player can increase their scoring average by just taking more shots even if they don’t hit a high percentage of those shots. Points per game does not account for how many opportunities a player’s missed shots hurt your team by taking away scoring opportunities that teammates may very well have cashed in on.
Overall Field Goal Percentage (combining two and three point shots)
Overall Field Goal Percentage of two and three point feel goals doesn’t tell us enough either. One player goes 5 for 12 and they are all 2 point shots, while another player goes 5 for 10 from three and 0 for 2 from two. First player produces 10 points for the team on their 12 shots and second player produces 15 points for the team on their 10 shots. That is a huge difference towards winning or losing.
Points per shot
This metric does not take into account missed free throws. It doesn’t need to be said that in a tight game, a team that misses more free throws has a major hurdle to overcome to get a victory.
You definitely have to play to the strengths of your players–no question. But if you can’t use your players strengths to find ways to get to the free throw line, to score at the basket, and make a competitive percentage of 3 point shots for the level your team plays, you probably won’t be a very effective team at the offensive end. So, it is imperative for the coach to have away of including those in your scoring evaluation.

Effective Field Goal Percentage (EFG%) is calculated using the following formula:
(Two Point Baskets Made + Three Point Baskets Made times 1.5)/divided by total field goal attempts
EFG% is a better indicator of how a player’s field goal shooting benefits the team because of the weight it gives to three point shots made. However it does not factor in missing free throws or making turnovers. Both of those are often the deciding factors in the outcome of a game.
Missed free throws and turnovers are at least as bad, and usually worse, than missing a field goal attempt. Let’s face it, if you have a chance to score while no one is guarding you, and you don’t score, you are really hurting your chance to win. And, if you turn the ball over in a live ball situation, you cost your team a chance to score. Additionally, the other team is more than likely going to get at least a numbers advantage fast break, and at worst an uncontested layup, or draw a foul in an attempt by the defense to stop that layup.
So, it just makes sense to account for turnovers and free throw accuracy when evaluating the scoring contribution that players make for the good of the team.
True Scoring Percentage (TS%) is the best measure of how well a player contributes to your overall scoring. We all know that there are other ways a player can contribute to your team’s offensive production besides scoring. But, being able to give a tangible way of determining which players give you the most bang for your possession in terms of putting points on the scoreboard for you.
One dilemma we face as already overworked and understaffed basketball coaches is being able to obtain the information that we need to improve without having to spend a lot of time or resources to do it. Calculating True Scoring Percentage will take very little time and no resources that you don’t already use.

A scorers table or LED video board from Sideline Interactive can help you:
* Promote your players on game night
* Generate excitement in your gym
* Help you raise $10,000 or more each year to improve your budget
And, if financing is a problem, we offer two school year, no fee, no interest financing to allow you to get your fundraising technology going and raise the money to pay for it before your final payment is due.
For a no hassle consultation on how we can help you, call Click (832) 786-0302 or click:
Fundraising, Excitement Generating Scoring Tables
The formula for True Scoring Percentage is in a nutshell taking the number of points a player scored divided by the times he or she ended the possession with a shot, a free throw, or a turnover. This can be easily calculated by a manger or assistant coach on a spreadsheet.
As a formula it is Points Divided by the sum of (Total Field Goals Attempted plus Total Trips to the FT Line-not counting and ones- plus Turnovers)
You can get Total Field Goal Attempts and Turnovers from the Box Score. You can get the Total Trips to the FT line for each player from the scorebook that your scorekeeper keeps at the scorers table.
For clarification:
A one and one is one trip to the line. If the player makes both, misses the first, or makes the first and misses the second, it is still one trip to the line. A two shot trip or a three shot trip, both count as one trip. The slight exception is that if a player makes the field goal and is fouled (and one! opportunity), don’t add that as a trip to the line. It only counts as a field goal attempt. The FT is a bonus for your team and for the players True Scoring Percentage.
The idea is that if the player is not taking advantage of all free throw attempts each time they go to the line, they are hurting the team.
This statistic is for individual players what Points Per 100 Possessions is for a team. It is a measure of a player’s contribution to the team’s point total based on how many opportunities there were for that player to contribute. You as a coach have a measure of tangible proof as to which players are taking too many shots and which players need to be taking more.
Coaching will always be subjective. There are a number of moving parts (literally) at both ends of the floor. We all know that to set our best scorers up when we have the basketball, we need to execute as a team with sureness (toughness) with the ball, passing, dribbling & driving, screening, spacing. And, we need to be able to rebound the shots that are missed. Those are essential skills not measured by True Scoring Percentage.
This article has focused solely on measuring individual scoring effectiveness for the team. It is not to say that True Scoring Percentage is the only measure you should use to evaluate players. It is not to say that you should determine playing time solely based on True Scoring Percentage.
It is to say that TS% is a better way to determine a player’s scoring contribution than by their field goal percentage or their points per game scoring average.
Other statistical data to use to help your offensive approach
If you like the concept of True Scoring Percentage, here are some other underused pieces of data that will probably interest you. These have been collected from various sources and I have recognized those sources.
Brad Stevens used Offensive Efficiency Rating (points per possession)
Goal should always be over 1.0 points per possession. To take that to the next level ‒ chart efficiency on possessions by number of ball reversals you have on offense.
Stevens found that at Butler, these were their numbers in the half court.
Zero reversals = .63 ppp
One reversal = .83 ppp
Two reversals = 1.1 ppp.
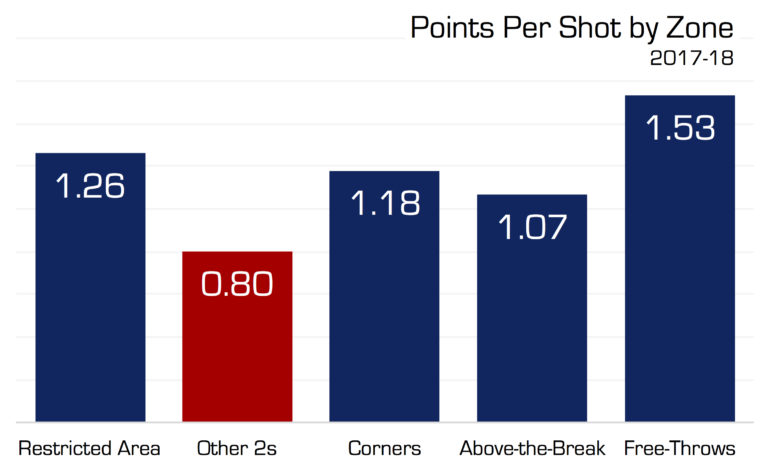
The following graph is from data on shooting is from the 2017-2018 NBA Season. (Source: Dr. Steven Shea, author of Basketball Analytics and Spatial Tracking and Basketball Analytics: Objectives and Efficient Strategies for Understanding How Teams Win)
This is a good refence and one that you can take a look at your shot chart to make a similar analysis in high school and college.
In high school, there is no “break” in the three point arc, but the data is still useful.
For this comparison, the 1.53 points per shot for Free Throws is based upon a two shot free throw trip. That equates to a 76.5% free throw percentage which is high for high school and college teams. That is why it is important to look at this from the perspective of your team’s data.
There is a statistical case to be made for why you should always foul at the end of the game when you are ahead by three points.
If you don’t agree with my percentage estimates, put in your own percentages and do the math to make a judgment that is based on reason, not on the fear of criticism you could receive if you do foul and then lose the game.
And, by all means, don’t “go with your gut” during the game. A decision that is as important as one that can potentially preserve a win or lead to a loss needs to be thought out in your office with input from your staff at some point when you can think logically and rationally.
Here is the system that we use. Our players know it, we practice it, and there is no confusion during the pressure of the end of a close game.
When the scoreboard is at seven seconds our defender takes the ball from the dribbler. His job is to get the basketball, even if he has to foul. We make a play on the basketball, not on the player with the basketball.
You have to be prepared for the possibility that you might not in the bonus and are going to need to foul again when the opponent inbounds the ball.

I have based my decision on the following estimated percentages.
An average three point shooter can hit 33%, or more, even when guarded. More and more players have extended their three point range to be able to hit from several steps behind the three point line. That makes it tougher to guard because there is a much bigger area to defend, not just the sector right on the arc.
If you foul, the opposition has to execute the following four plays successfully.
#1 They have to make the first free throw. We’ll assume you foul an 80% ft shooter (during the intense pressure of a close game)
#2 They have to miss the second free throw on purpose. More than likely the other team has not practiced how to miss a free throw in a way that allows them to get the rebound. I say 90% of the time they can miss the free throw on purpose and put the ball in play for a rebound.
#3 The shooting team must get the offensive rebound. I am going to give the shooting team a 40% chance of getting the rebound. I believe that the actual percentage is lower than that, but I want to error on the side of going against the point I am working to prove.
#4 The offensive team must score. I am going to estimate a 67% success rate which again, I believe is high.
The percentage chance that all four of those plays are executed consecutively under pressure is:
80% x 90% x 40% x 67% = 19.3%
19.3% is lower than my earlier estimate of an average 33% shooter making a three point shot to tie the game. My philosophy is that we foul every time to avoid the confusion at the end of the game. Whether you agree or disagree with my assessment, I encourage you to develop your own philosophy and practice it so that you don’t leave your end of the game execution to guessing and chance.